
Figure 5. Reduced microglia response to viral infection under GF conditions.
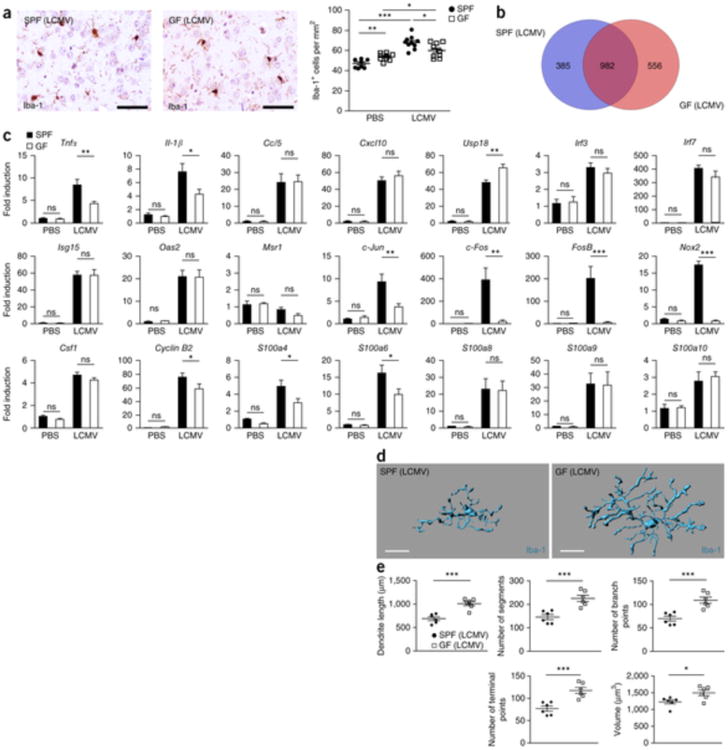
(a) Iba-1 immunhistochemistry depicting cortical microglia response 4 d after i.c. challenge with LCMV (left) and quantification (right). Each symbol represents one mouse, with nine PBS-treated control mice and ten LCMV-treated mice. Three to four sections per mouse were examined. Data are presented as mean ± s.e.m. Data are representative of two independent experiments. Significant differences were determined by an unpaired t test (*P < 0.05, **P < 0.01, ***P < 0.001). P values: SPF (PBS) versus GF (PBS): 0.0024; SPF (PBS) versus SPF (LCMV): 0.0001; GF (PBS) versus GF (LCMV): 0.0323; SPF (LCMV) versus GF (LCMV): 0.0222. Scale bars represent 50 μm. (b) Venn diagram illustrating the differences and overlaps between microglia from GF and SPF animals in significantly (P < 0.01) up- or down-regulated genes 4 d after LCMV treatment compared with PBS-treated controls of the same housing conditions (GF/SPF). (c) qRT-PCR in microglia 4 d after i.c. LCMV exposure. Data are expressed as the ratio of the mRNA expression compared with endogenous Actb relative to SPF controls and show mean ± s.e.m. Ten LCMV-treated and three PBS-control mice were analyzed for both housing conditions, respectively. Data are representative of two independent experiments. Significant differences were examined by an unpaired t test (*P < 0.05, **P < 0.01, ***P < 0.001). ns, not significant. P values: PBS: Tnfα, 0.5082; Il-1β, 0.5025; Ccl5, 0.7325; Cxcl10, 0.8510; Usp18, 0.8331; Irf3, 0.7942; Irf7, 0.4691; Isg15, 0.5344; Oas2, 0.0738; Msr1, 0.8069; c-Jun, 0.3162; c-Fos, 0.2778; FosB, 0.2491; Nox2, 0.3746; Csf1, 0.1224; cyclin B2, 0.1297; S100a4, 0.1463; S100a6, 0.1296; S100a8, 0.2677; S100a9, 0.4182; S100a10, 0.8502. LCMV: Tnfα, 0.0072; Il-1β, 0.0315; Ccl5, 0.9502; Cxcl10, 0.3839; Usp18, 0.0013; Irf3, 0.3887; Irf7, 0.2704; Isg15, 0.9575; Oas2, 0.9831; Msr1, 0.0579; c-Jun, 0.0042; c-Fos, 0.0016; FosB, 0.0008; Nox2, 0.0001; Csf1, 0.2828; cyclin B2, 0.0491; S100a4, 0.0415; S100a6, 0.0374; S100a8, 0.9149; S100a9, 0.9459; S100a10, 0.6775. (d,e) Three-dimensional reconstruction (scale bars represent 15 μm, d) and Imaris-based automatic quantification of cell morphometry (e) of cortical Iba-1+ microglia 4 d after i.c. LCMV exposure. Each symbol represents one mouse with at three measured cells per mouse. Six animals were analyzed per group. Data are presented as mean ± s.e.m. Significant differences were determined by an unpaired t test (*P < 0.05, ***P < 0.001). P values: dendrite length, 0.0003; number of segments, 0.0009; number of branch points, 0.0008; number of terminal points, 0.0009; volume, 0.0234.