
Figure 7. Only complex microbiota can restore microglia insufficiency.
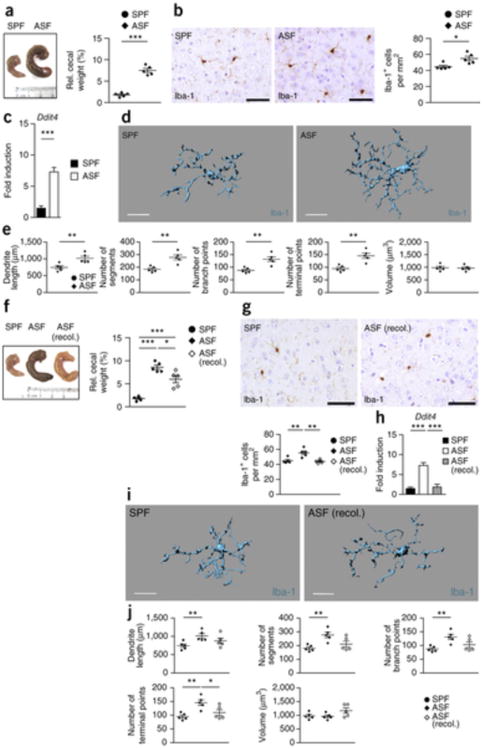
(a) Left, macroscopical view on cecum from SFP animal (control) and an individual with altered Schaedler flora (ASF). Ruler scale is shown. Representative pictures are displayed. Right, relative cecum weight of ASF and control SPF mice. Symbols represent individual mice, with five examined mice per group. Data are presented as mean ± s.e.m. Significant differences were determined by an unpaired t test (***P = 0.0001). Data are representative of two independent experiments. (b) Iba-1+ immunohistochemistry (left) in the cortex of ASF and control mice and quantification thereof (right). Every symbol represents one mouse. Five mice per group were investigated and three to four sections per mouse were examined. Data are presented as mean ± s.e.m. Significant differences were evaluated by an unpaired t test and marked with asterisks (*P = 0.0143). Data are representative of two independent experiments. Scale bars represent 50 μm. (c) Ddit4 mRNA measured by qRT-PCR in microglia from SPF (black bar) or ASF (white bar) mice. Data are presented as mean ± s.e.m. with at least five samples in each group. Significant differences were determined by an unpaired t test (***P = 0.0001). Data are representative of two independent experiments. (d,e) Three-dimensional reconstruction (d) of representative Iba-1+ parenchymal microglia from ASF or SPF control mice, respectively. Scale bars represent 15 μm. Automatic Imaris-based quantification of cortical microglia morphology (e) is shown. Each symbol represents one mouse per group with at least three measured cells per mouse. Five animals per group were analyzed. Data are presented as mean ± s.e.m. Significant differences were evaluated by an unpaired t test (**P < 0.01). P values: dendrite length, 0.0099; number of segments, 0.0025; number of branch points, 0.0031; number of terminal points, 0.0022. (f) Left, macroscopical view of cecum from SPF (control), ASF and recolonized ASF mice. Ruler scale is shown. Representative pictures are shown. Right, relative cecum weight of ASF, recolonized ASF and control SPF mice. Symbols represent individual mice, with five mice per group. Data are presented as mean ± s.e.m. Significant differences were determined by an unpaired t test (*P < 0.05, ***P < 0.001). P values: SPF versus ASF, 0.0001; SPF versus ASF (recol.), 0.0008; ASF versus ASF (recol.), 0.0202. Data are representative of two independent experiments. (g) Top, immunohistochemistry for Iba-1+ in the cortex of recolonized ASF and control mice. Bottom, quantification. Three to four sections per mouse were examined. Every symbol represents one mouse, with five mice per group. Data are presented as mean ± s.e.m. (**P < 0.01). P values: SPF versus ASF, 0.0072; ASF versus ASF (recol.), 0.00250. Data are representative of two independent experiments. Scale bars represent 50 μm. (h) Quantitative measurement of Ddit4 mRNA by qRT-PCR in microglia from SPF (black bar), recolonized ASF (gray) and ASF (white bar) mice. Data are presented as mean ± s.e.m. with five samples in each group. Significant differences were determined by an unpaired t test (***P < 0.001). P values: SPF versus ASF, <0.0001; ASF versus ASF (recol.), 0.0001. Data are representative of two independent experiments. (i) Three-dimensional structure of a representative microglia cell of recolonized ASF or SPF control mice. Scale bars represent 15 μm. (j) Imaris-based morphometric measurements of cortical Iba-1+ microglia. Each symbol represents one mouse per group with three measured cells per mouse. Data are presented as mean ± s.e.m. Significant differences were evaluated by an unpaired t test (*P < 0.05, **P < 0.01). P values: dendrite length, SPF versus ASF, 0.0099; number of segments, SPF versus ASF, 0.0025; number of branch points, SPF versus ASF, 0.0031; number of terminal points, SPF versus ASF, 0.0022; ASF versus ASF (recol.), 0.0386.