
Figure 1.
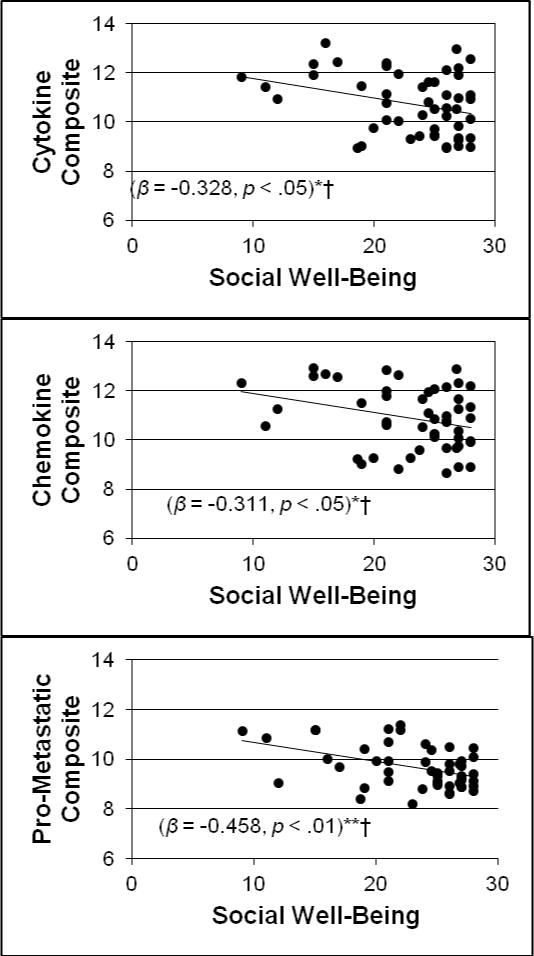
Scatterplots depicting the association between social well-being and pro-inflammatory and pro-metastatic gene expression composites after breast cancer surgery controlling for age, stage of disease, days since surgery, education, and BMI.
*p < .05 **p < .01
†Remains statistically significant after application of the Benjamini-Hochberg procedure at a false discovery rate of 0.10.
a Scatterplot depicts data after winsorization. Gene expression reported in RNA expression units (log2).