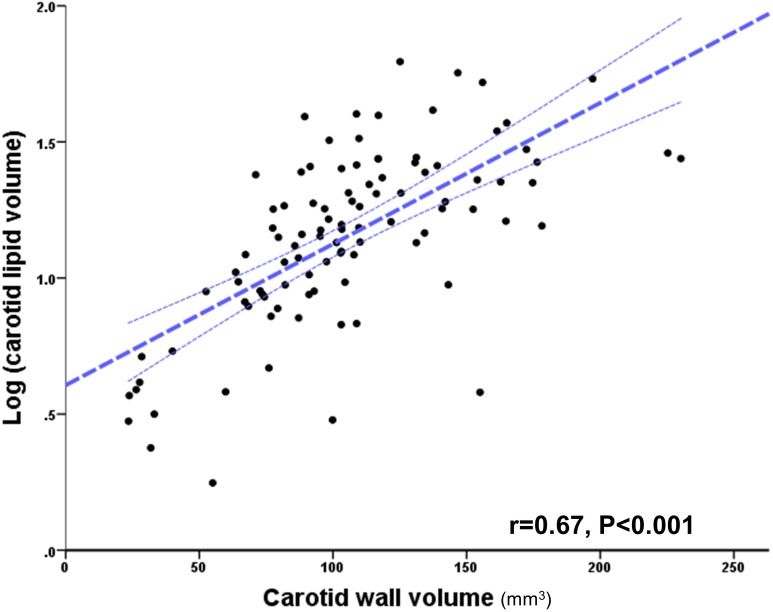
Fig 4. Correlation between carotid plaque and lipid volume (log transformed).
Scatter plot graph illustrating a strong correlation between plaque lipid content and plaque volume in total of one hundred carotid arteries analysed using T2 map. Dotted lines indicate 95% confidence intervals. Note that increasing plaque size is associated with an increasing variation of lipid content; i.e. points fall further outside the 95% CI.

