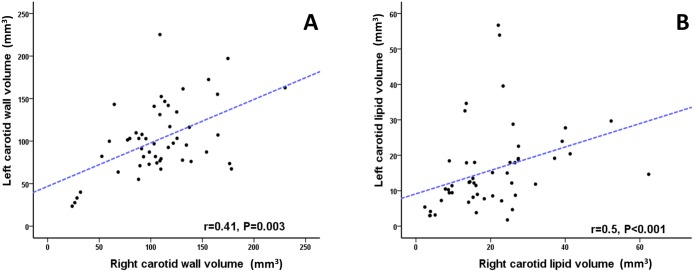
Fig 5. Spearman’s rank correlation between left and right carotid plaque and lipid volume.
(A) Scatter plot graph demonstrating statistically significant correlation between plaque burden (total plaque volume) between left and right carotid arteries. (B) Scatter plot graph showing statistically significant correlation between lipid volumes of the right and left carotid arteries quantified on T2 map (panel B).

