
Figure 6.
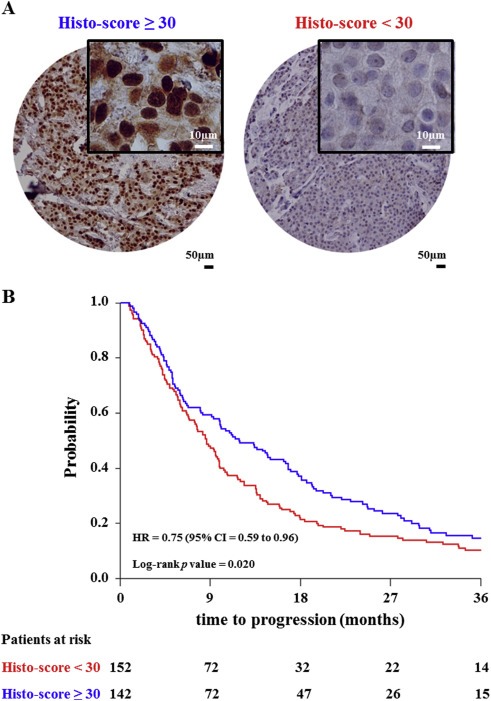
PDCD4 immunohistochemical staining of tissue micro‐array. Tissue cores showed two different staining patterns that have been evaluated by histo‐score (i.e. Histo‐score < 30 and ≥ 30), representing low and high PDCD4 protein expression (A). Patients were categorized according to histo‐score cutoff and TTP was plotted as a Kaplan–Meier curve. The Log‐rank test was used to test for differences in TTP between the two survival curves (B). Acronym: HR: hazard ratio; CI: confidence interval.