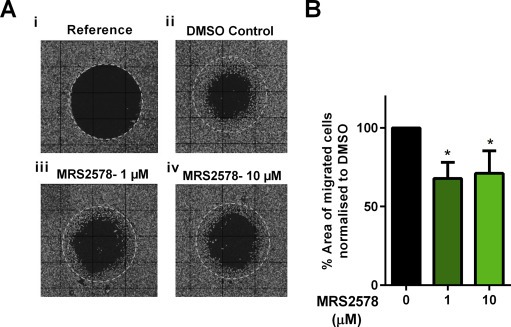
Figure 6.

Effect of P2Y6 pharmacological inhibition on the migration of MDA‐MB‐231 cells. (A) Representative fluorescence images of (i) reference (where stoppers were removed immediately prior to imaging to show the original detection zone); and migration after 24 h with media containing (ii) DMSO (control) or (iii and iv) the P2Y6 inhibitor MRS2578 (1 μM and 10 μM). (B). Cell migration was quantified as the percentage of migrated cell area normalized to the DMSO controls. Data are mean (+SD) from three independent experiments performed in duplicate wells, *p < 0.05 (Benferroni one‐way ANOVA).
