
Figure 3.
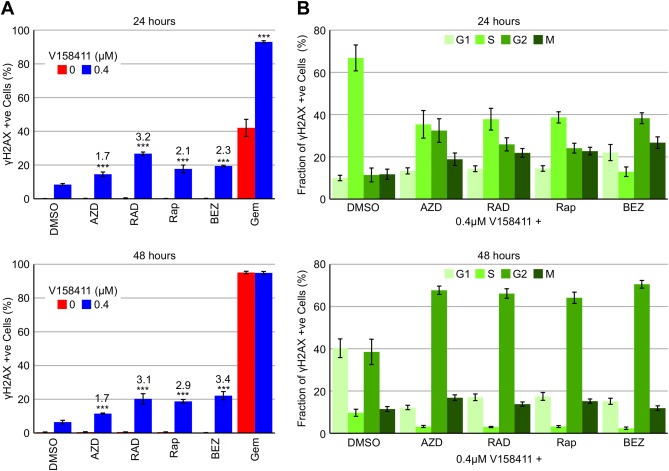
Inhibition of mTOR increases V158411 induced DNA DSB. HT29 cells were treated with 0.1 μM of the mTOR inhibitors AZD8055, RAD‐001, rapamycin or BEZ235, or gemcitabine in combination with 0 or 0.4 μM of the Chk1 inhibitor V158411 and pH2AX (S139) expression determined by high content analysis. (A) The fraction of γH2AX positive cells was determined by high content image analysis with Harmony software. The fold increase in γH2AX positive nuclei compared to V158411 + DMSO treatment alone is indicated above the bars. ***, P < 0.001. (B) Cell cycle phase of γH2AX positive nuclei was determined by high content image analysis using Harmony software following counterstaining for EdU and pHH3 (S10). Values are the average of 4 determinations ± SD.