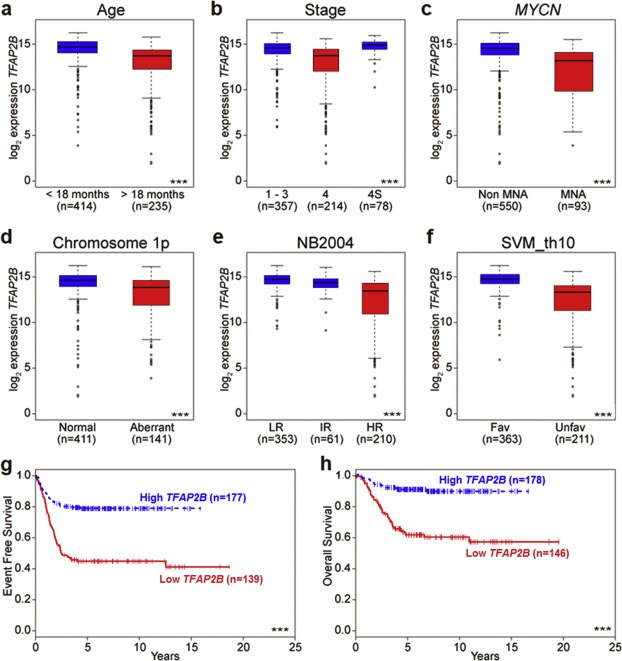
Figure 1.

Association of TFAP2B expression levels with prognostic markers and outcome in neuroblastoma. Association of (a) age at diagnosis, (b) tumor stage, (c)MYCN amplification status, (d) chromosome 1p status, (e) risk stratification according to NB2004, and (f) gene expression‐based classification (according to the SVM_th10 classifier) with TFAP2B transcript levels in 649 neuroblastoma samples as determined by microarray gene expression analysis. Boxes, median expression values (horizontal line) and 25th and 75th percentiles; whiskers, distances from the end of the box to the largest and smallest observed values that are <1.5 box lengths from either end of the box; circles, outliers. (g) EFS and (h) OS of neuroblastoma patients in the validation set according to the prognostic TFAP2B expression cut‐off determined in the training set. n = patient number; (***), p < 0.001.
