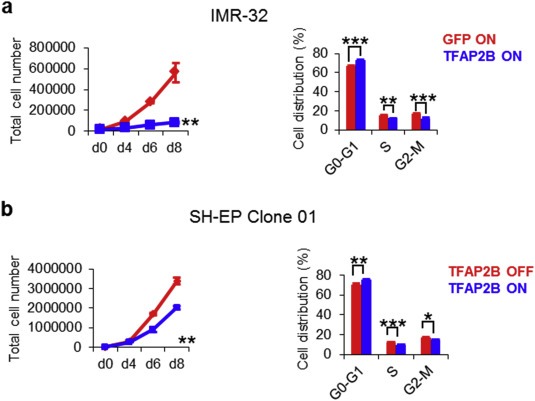
Figure 4.

TFAP2B re‐expression inhibits growth of neuroblastoma cells. (a) Proliferation of IMR‐32 and SH‐EP cells upon TFAP2B re‐expression as assessed by trypan blue dye exclusion analysis. (b) Cell cycle analysis of IMR‐32 and SH‐EP cells at day 6 after TFAP2B induction as determined by FACS analysis. Fraction of cells in G0/G1 phase: SH‐EP OFF, 69.05% ± 0.47%; SH‐EP ON, 74.03% ± 0.26%, p < 0.01; IMR‐32 GFP, 65.50% ± 0.84%; IMR‐32 TFAP2B, 70.58% ± 0.59%, p < 0.001. Error bars indicate S.D; (n.s.), p > 0.05; (*), p < 0.05; (**), p < 0.01; (***), p < 0.001).
