
Figure 1.
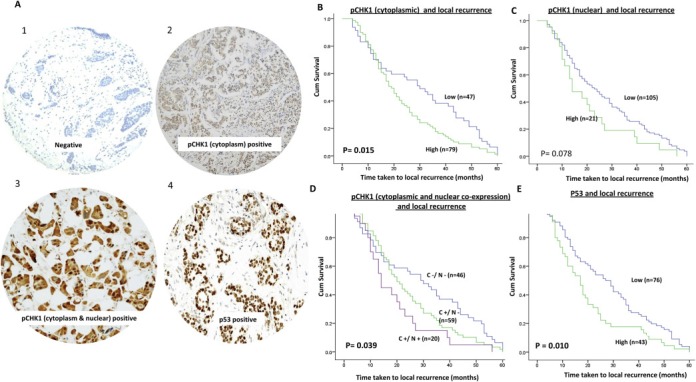
A. Microphotograph of pCHK1 and p53 protein expression in breast tumours [1 = negative, 2 = pCHK1 cytoplasmic staining, 3 = pCHK1 cytoplasmic & nuclear staining and 4 = p53 staining]. Kaplan Meier curves showing time taken to local recurrence based on B. pChk1 cytoplasmic expression; C. pChk1 nuclear expression D. pChk1 cytoplasmic & pChk1 nuclear co‐expression; D. p53 expression.