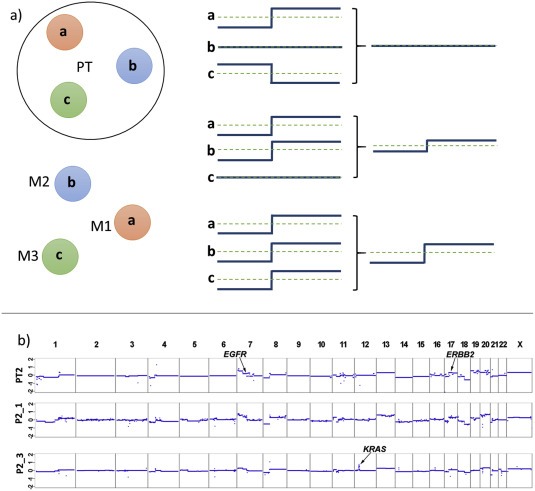
Figure 3.

Scenarios and outcomes observable with plasma‐Seq. (a) Plasma‐Seq copy number profiles represent an average of all cells releasing DNA into the circulation, e.g. from different clones within a tumor lesion (PT) or from various tumor lesions, i.e. metastatic deposits (M1–M3) (designated as a, b, and c). If all lesions have the same SCNAs they are visible with large amplitude (bottom), the amplitude decreases, if the SCNA is present in a subset of lesions only (center). If the SCNA pattern varies in different lesions they may even not be visible at all (top). (b) Copy number analyses of a primary tumor (PT2) and two plasma analyses (P2_1, 27 months after diagnosis of the primary tumor; P2_3, 6 months after P2_1) from the same patient. The X‐ and Y‐axes indicate the chromosome and the log2‐ratios, respectively. The locations of the EGFR, ERBB2 and KRAS genes are indicted in PT2 or P2_3. The profiles were taken from one of our previous studies (Mohan et al., 2014).
