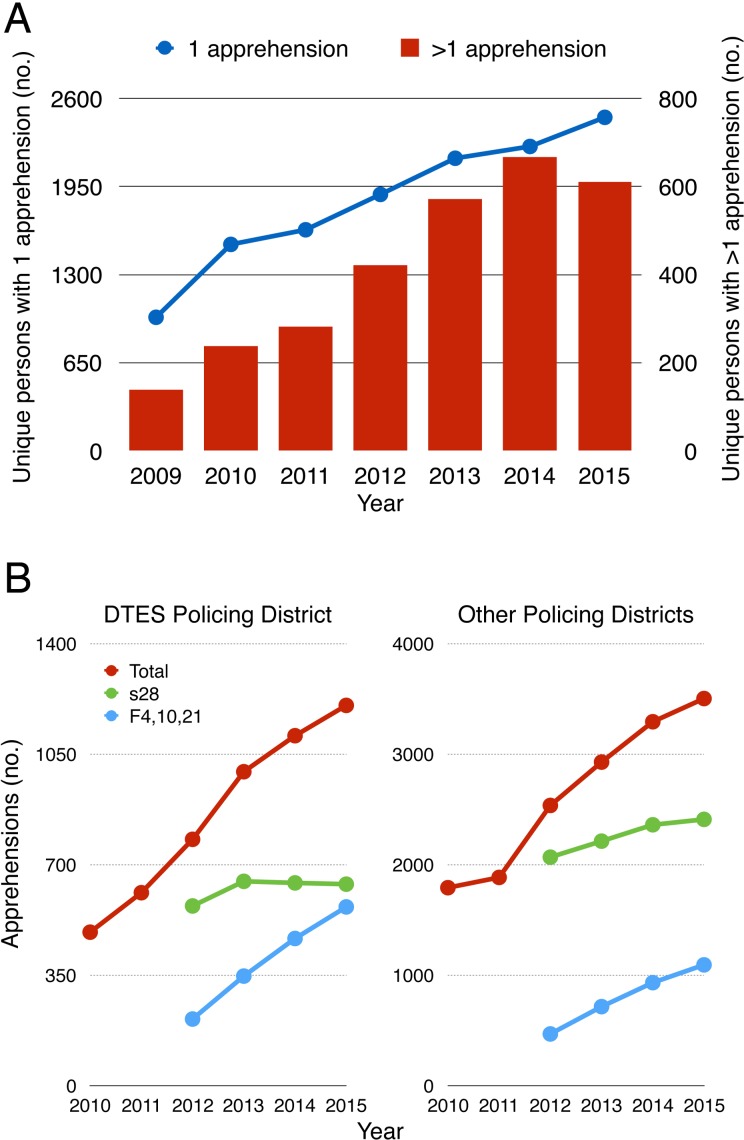
Figure 2.
Trends in police apprehensions related to mental illness. (A) Numbers of unique individuals with a single apprehension in a year are shown with the gray line and the left y-axis. Numbers of unique individuals with more than 1 apprehension in the same year are shown as black bars and the right y-axis. (B) Data for total apprehensions, apprehensions initiated by police (s28), and apprehensions initiated by mental health care providers (F4, 10, 21). The left panel shows the relative increase in care provider-initiated apprehensions in the Downtown Eastside (DTES) relative to other policing districts.

