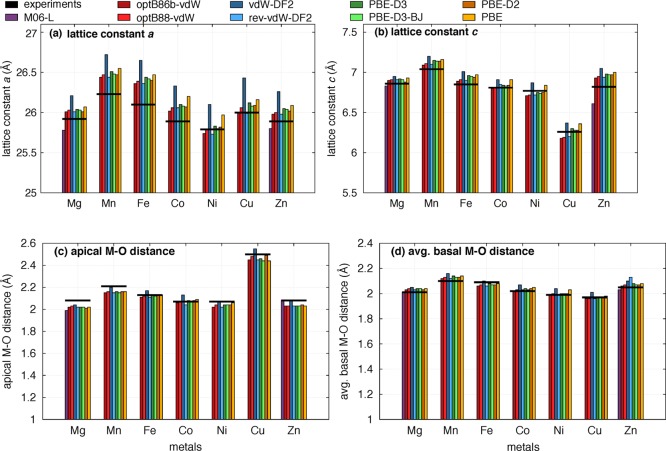
Figure 2.
Calculated lattice constants and metal–oxygen distances for the M2(dobdc) series with PBE, optB88-vdW, optB86b-vdW, vdW-DF2, rev-vdW-DF2, PBE-D2, PBE-D3, PBE-D3 BJ, and M06-L. The primitive cell used for the calculations was converted to a conventional cell to compare with experiment (Mg NPD at 20 K,89 Mn XRD,31 Fe NPD at 9 K,24 Co XRD at 368 K,26 Ni XRD at 295 K,27 Cu XRD at 100 K,76 and NPD at 10 K43). The apical and basal M–O distances are shown in Figure 1.

