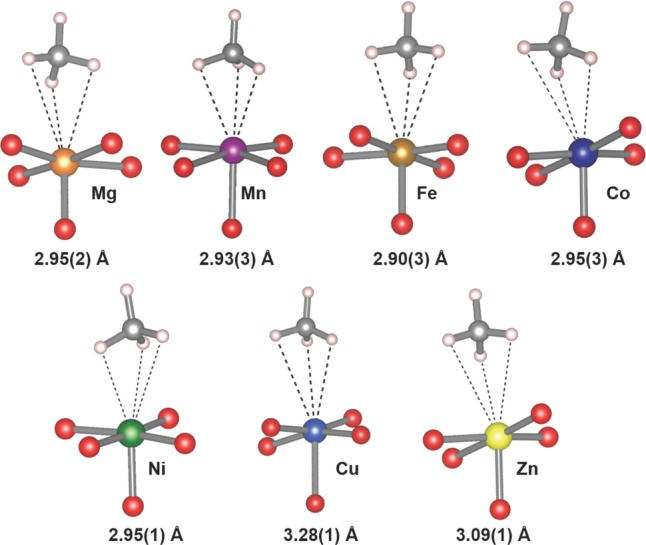
Figure 3.

Methane molecule adsorbed at the metal site for the M2(dobdc) series, as determined by NPD. The distance listed represents the distance from the respective metal center to the carbon atom of the CD4 molecule. Values in parentheses indicate one standard deviation.
