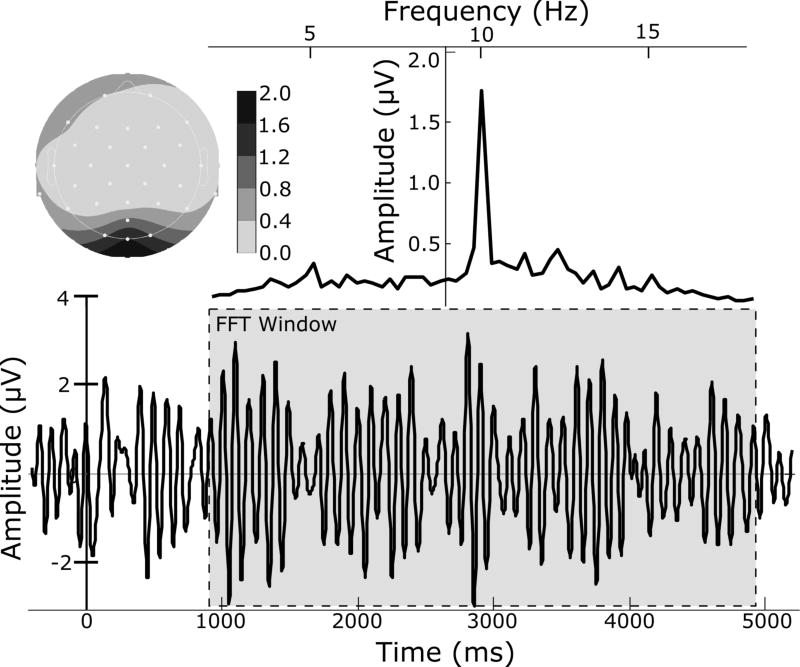
Figure 1.
Time series of the filtered (5–15 Hz) EEG for one representative subject, averaged over all trials and segmented relative to onset of the Gabor patch which alternated at 10 Hz, evoking the ssVEP (bottom). This 10-Hz oscillation is the dominant signal as illustrated by the frequency domain data (top right) and is strongest over sensor Oz (top left), achieved by a Fourier transformation on a 4000-msec segment of EEG data (bottom, gray box).

