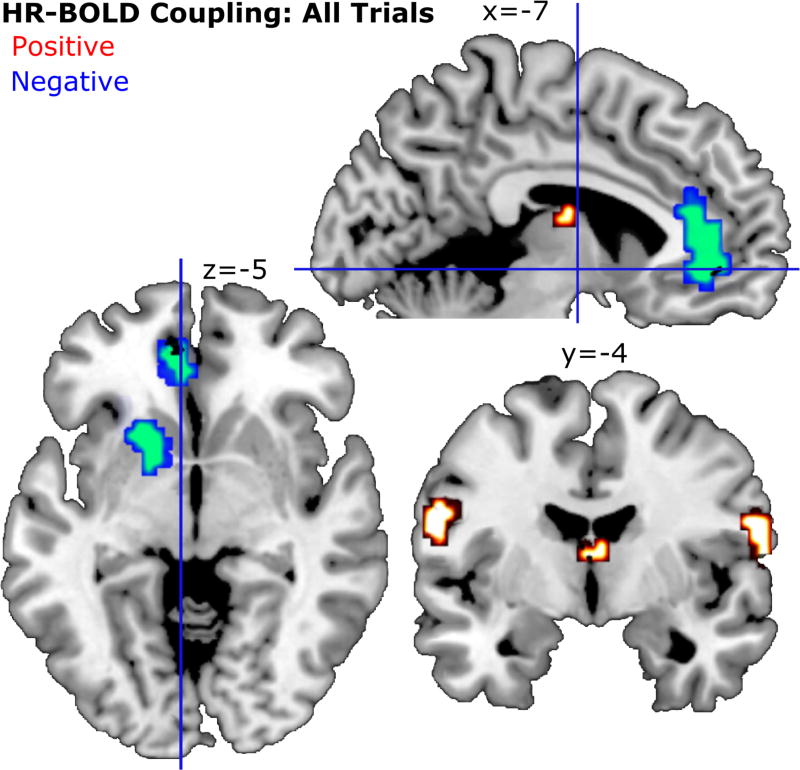
Figure 6.
Group level analysis (N = 15) for HR-BOLD coupling across all trials. As in previous figures, clusters shown here pass a voxel-wise threshold of t = 2.62 and a cluster-extent threshold of k = 14. MNI coordinates are noted above each corresponding slice. One cluster near the thalamus shown in this figure largely overlapped with aspects of the third ventricle and thus is not reported here.

