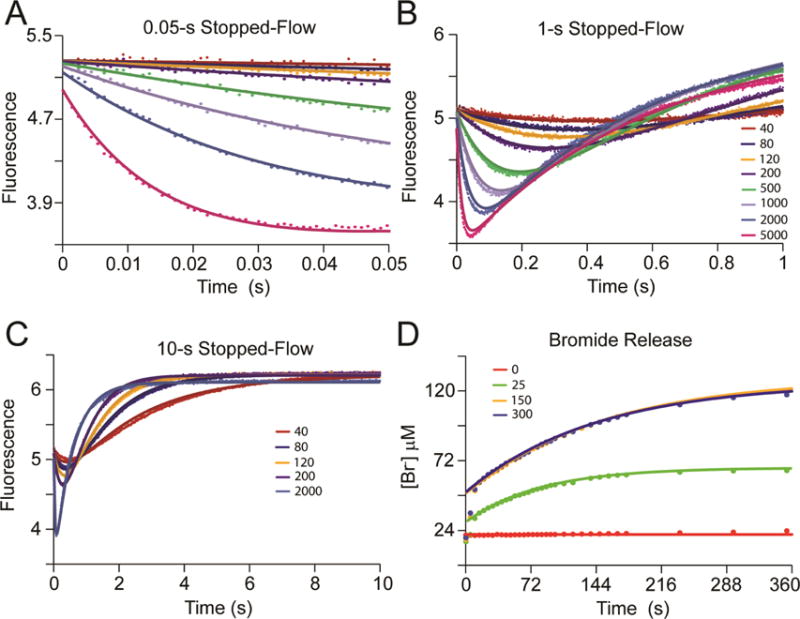
Figure 2.

Global Data Fitting of αY60W-CaaD and 3-Bromopropiolate (10).18 The αY60W-CaaD kinetic data with 10 globally fit by simulation to the mechanism shown in Scheme 6. A) Stopped-flow fluorescence traces (0.05 s) for 10 (0–5000 μM) and αY60W-CaaD. B) Stopped-flow fluorescence traces (1 s) for 10 (0–5000 μM) and αY60W-CaaD. C) Stopped-flow fluorescence traces (10 s) for 10 (0–2000 μM) and αY60W-CaaD. D) The free bromide release with wild-type CaaD and 10. Concentrations of 10 are shown in the legends. Colors corresponding to the concentrations of 10 are the same in A-C. For A-C, the solid lines are the fits to the data by simulation. For D, the solid lines represent a fit to the data to eq 6. A summary of the numerical values is shown in Table 1.
