
Fig. 6. In vitro reconstruction of petal color by mixing isolated components.
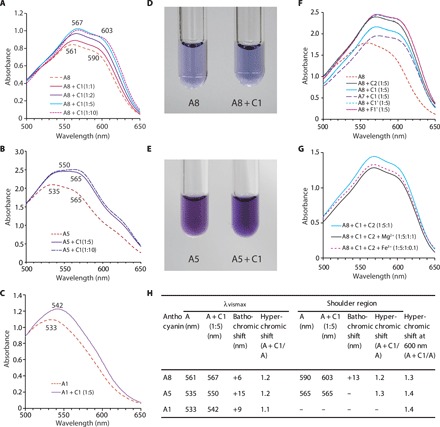
Anthocyanin and copigment were mixed in acetate buffer (pH 5.6). (A) Visible absorption spectra of A8 and its mixture with C1. (B) Visible absorption spectra of A5 and its mixture with C1. (C) Visible absorption spectra of A1 and its mixture with C1. (D) Color of A8 solution (left) and its mixture with C1 (1:10) (right). (E) Color of A5 solution (left) and its mixture with C1 (1:10) (right). (F) Visible absorption spectrum of mixture of A7 or A8 with various flavone glycosides (C1, C2, C1′, and F1′). (G) Visible absorption spectra of a mixture of A8, C1 and C2 solution and its mixture with Fe3+ or Mg2+ ion. (H) Summary of bathochromic shifts and hyperchromic shifts by A8, A5, and A1 solutions by mixing with C1 (1:5). A8, ternatin C5; A5, delphinidin 3-O-(6′′-O-malonyl)glucoside; A1, cyanidin 3-O-(6″-O-malonyl)glucoside; C1, luteolin 7-O-(6″-O-malonyl)glucoside; C2, tricetin 7-O-(6″-O-malonyl)glucoside; C1′, flavone 7-O-glucoside; F1′, apigenin 7-O-glucoside.