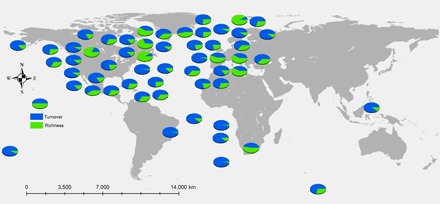
Fig. 2. Beta diversity partition of assemblage time series.

Each pie chart represents a different assemblage, plotted at its jittered location on the globe. Beta diversity was partitioned using the method of Baselga (29). Blue fraction, proportion of beta diversity attributable to changes in species composition; green fraction, proportion of beta diversity attributable to changes in species richness.
