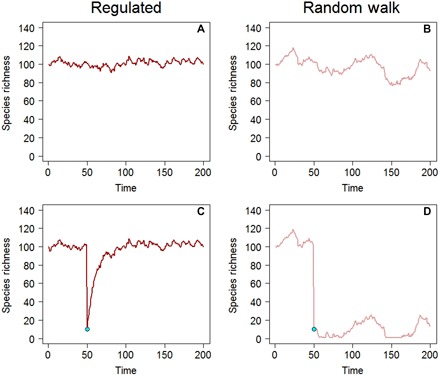
Fig. 3.

Contrasting dynamics of regulated assemblages versus random walks. In the absence of a perturbation, it is difficult to visually distinguish the dynamics of a regulated assemblage (A) versus an unconstrained random walk (B), although they are discriminated by the ADF test [P = 0.020 (A) and P = 0.545 (B)]. However, if the assemblage is reduced in a single time step from its equilibrium level of 100 species to 10 species, the regulated assemblage recovers (C), whereas the unregulated assemblage does not (D). Trajectories were simulated with an AR1 autoregressive model, ΔN = Nt + 1 − Nt = − (Nt − c)(1 − φ) + εt, where c = 100 and εt ~ N(0, σ = 2). For the regulated trajectories, φ = 0.900, and for the random walk trajectories, φ = 0.999. To simplify the appearance of (D), simulated values that were less than 1 were redrawn as 1. The ADF test is a one-tailed statistical test for whether |φ| < 1.0.
