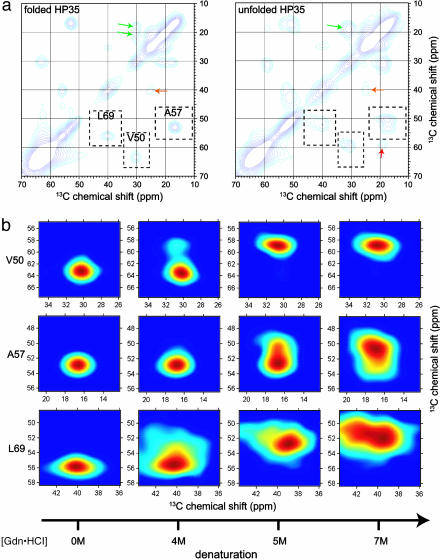
Fig. 2.
Two-dimensional solid-state 13C spectra of HP35 in frozen solution. (a) Aliphatic regions of 2D spectra at [Gdn·HCl] = 0M(Left)and7M(Right). Dashed boxes enclose Cα/Cβ crosspeaks for 13C-labeled V50, A57, and L69. Contour levels increase by successive factors of 1.3. Arrows indicate Cβ/Cγ crosspeaks of V50 (green), Cβ/Cγ crosspeaks of L69 (orange), and Cα/Cγ crosspeaks of V50 (red). (b) Expansions showing the dependence of Cα/Cβ crosspeak shapes on [Gdn·HCl]. Color scales run from the maximum signal intensity in each crosspeak (dark red) to 15% of the maximum intensity (dark blue). Differences in crosspeak shapes at high [Gdn·HCl] reflect site-specific differences in conformational distributions.

