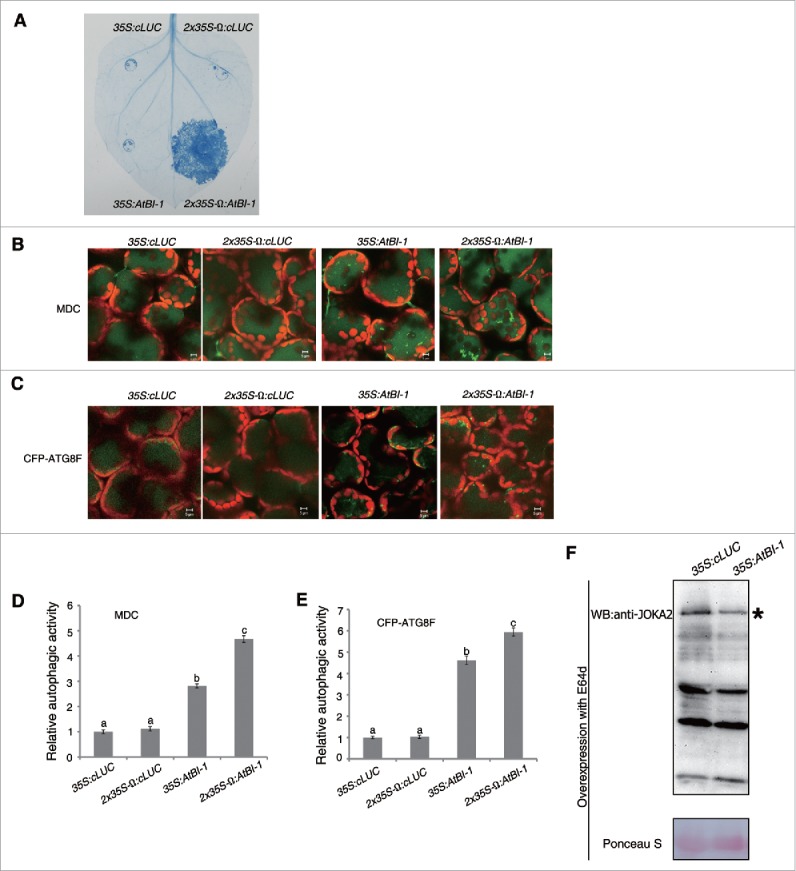
Figure 6.

Overexpression of plant BI-1 trigged cell death and increased autophagic activity. (A) Trypan blue staining of cell death. Agrobacteria containing 35S:cLUC, 2 × 35S-Ω:cLUC, 35S:AtBI-1, and 2 × 35S-Ω:AtBI-1 were infiltrated into N. benthamiana. At 3 dpi, leaves were detached for trypan blue staining. (B) Representative images of MDC-stained autophagic structures from leaf tissues agroinfiltrated with 35S:cLUC, 2 × 35S-Ω:cLUC, 35S:AtBI-1, and 2 × 35S-Ω:AtBI-1 at 48 h postinfiltration (hpi), when no macroscopic cell death was apparent. (C) Representative images of CFP-ATG8F-labeled autophagic structures from leaf tissues agroinfiltrated with 35S:cLUC, 2 × 35S-Ω:cLUC, 35S:AtBI-1, and 2 × 35S-Ω:AtBI-1 at 48 hpi. The puncta in the mesophyll cells were autophagic structures. Scale bars ((B)and C): 5μm. (D) The relative autophagic activity in MDC-stained tissue. The number of MDC-stained autophagic structures per leaf section was counted and normalized to that of 35S:cLUC or 2 × 35S-Ω:cLUC control, respectively. Data are the means ± SEM of relative autophagic activity, with the mean value of control set to 1.0 (n = 10). Different letters (a to c) above bars represent significantly different groups. (E) The relative autophagic activity in CFP-ATG8F-labeled tissue. The number of CFP-ATG8F-labeled autophagic structures per leaf section was counted and normalized to control respectively. Data are the means ± SEM of relative autophagic activity, with the mean value of control set to 1.0 (n = 10). Different letters (a to c) above bars represent significantly different groups. (F) Overexpression of AtBI-1 decreased the accumulation of JOKA2. Ponceau S staining was used as loading control. Experiments were repeated at least 2 times. All autophagy-related experiments were performed with E64d treatment.
