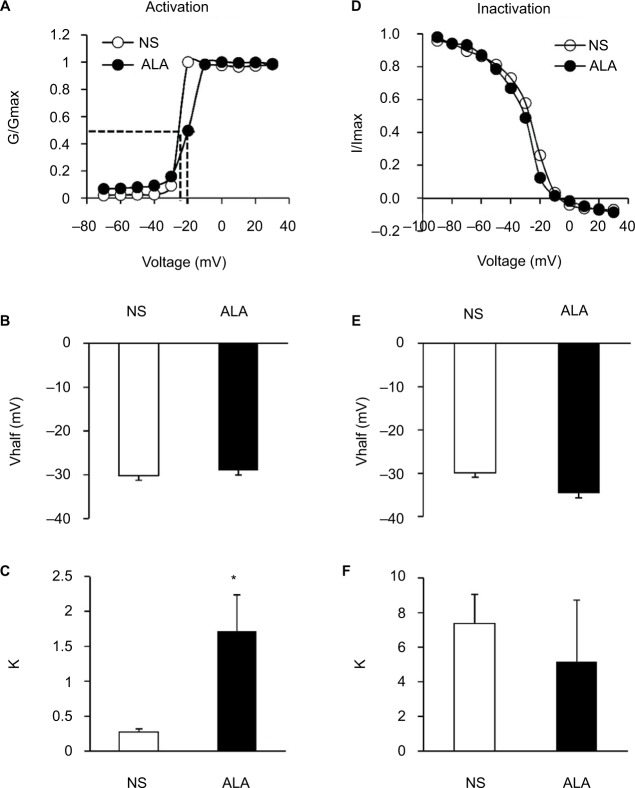
Figure 6.
Changes of activation and inactivation curves of sodium channel currents.
Notes: (A) Activation curves of sodium currents were generated by stimulation steps from −70 to +30 mV in 10 mV increment in DRG neuron from NS- and ALA-treated rat. (B) ALA treatment did not change the V1/2 (n=10 for each group, p>0.05, compared with NS- group, Mann–Whitney test). (C) The slope factor (k) in activation of sodium current changed significantly after ALA treatment (n=10 for each group, *p<0.05, compared with NS group, Mann–Whitney test). (D) Steady-state inactivation curves of sodium currents evoked by conditional steps of various voltages from −90 to +30 mV with 10 mV increment in DRG neuron from NS- and ALA-treated rat. (E, F) ALA treatment did not change the V1/2 and k in inactivation of sodium current (n=9 for each group, p>0.05, compared with NS, Mann–Whitney test).
Abbreviations: ALA, α-lipoic acid; DRG, dorsal root ganglion; k, slope factor; NS, normal saline; V1/2, half-maximal activation potential.

