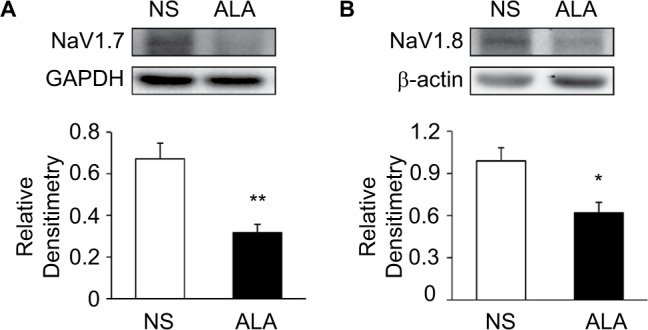
Figure 7.

ALA downregulated NaV1.7 and NaV1.8 expression.
Notes: (A) Western blots for NaV1.7 of T13-L2 DRGs from NS- and ALA-treatment rats. Bar graph showed mean density relative to GAPHD for NaV1.7. ALA treatment greatly reduced expressions of NaV1.7 (n=4 for each group, **p<0.01, compared with NS, two-sample t-test). (B) Western blots for NaV1.8 of T13-L2 DRGs from NS- and ALA-treatment rats. Bar graph showed mean density relative to β-actin for NaV1.8. ALA treatment greatly reduced expressions of NaV1.8 (n=5 for NS group, n=4 for ALA group, *p<0.05, compared with NS, two-sample t-test).
Abbreviations: ALA, α-lipoic acid; DRG, dorsal root ganglion; NS, normal saline.
