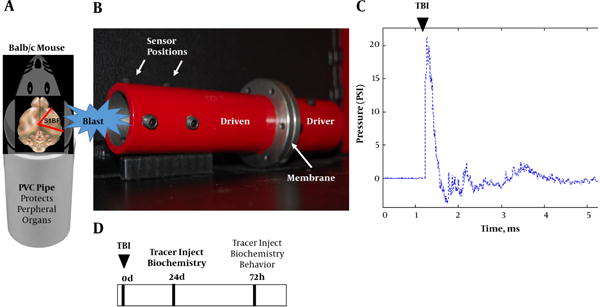
Figure 1. Mouse Blast Model, Freidlander Curve and Experimental Design.

A, schematic shows mouse placed into PVC pipe with the blast wave impacting the right side of the head (S1BF cortex); B, photograph of mouse shock tube model; C, classic Freidlander curve produced by the blast wave with a peak overpressure of ~ 20 psi for a duration of 0.5 ms; D, experimental design.
