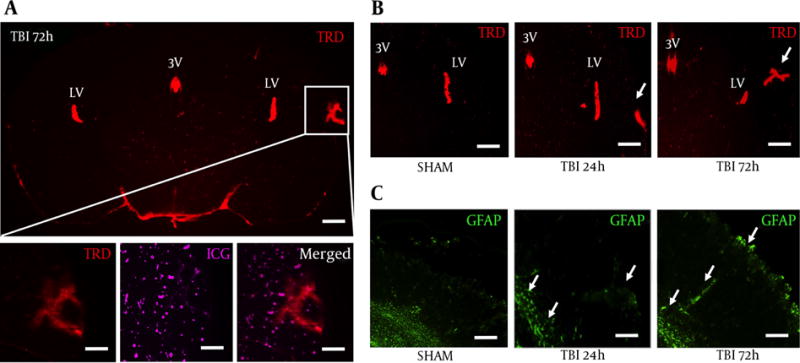
Figure 2. Blast Induced Blood-Brain Barrier Disruption in the S1BF Cortex.

A, a coronal brain slice imaged at 1.25× shows Texas Red conjugated dextran 3 kDa distribution within the S1BR region (outlined by white box) at 72 hours post-blast; scale bars = 500 μm; B, Bottom panels are from white box above imaged at 6.3× to show vascular disruption: TRD distribution (left), ICG distribution (middle), merged (right); scale bars = 100μm. Brain slices imaged at 3.2x show increased TRD distribution in the S1BF region at 72 hour post-blast compared to SHAM and 24 hours post-blast animals; Scale bars = 200 μm. Arrows demarcate vascular disruption within the ipsilateral S1BF region; C, adjacent brain slices imaged at 3.2× show increased GFAP fluorescence in the S1BF region at 72 hour post-blast compared to SHAM and 24 hours post-blast animals; scale bars = 200 μm. Arrows demarcate astrocyte reactivity within the ipsilateral S1BF region and near grey/white matter junctions; LV = lateral ventricle; 3V = third ventricle; TRD = texas red dextran; ICG = indocyanine green; GFAP = glial fibrillary acidic protein.
