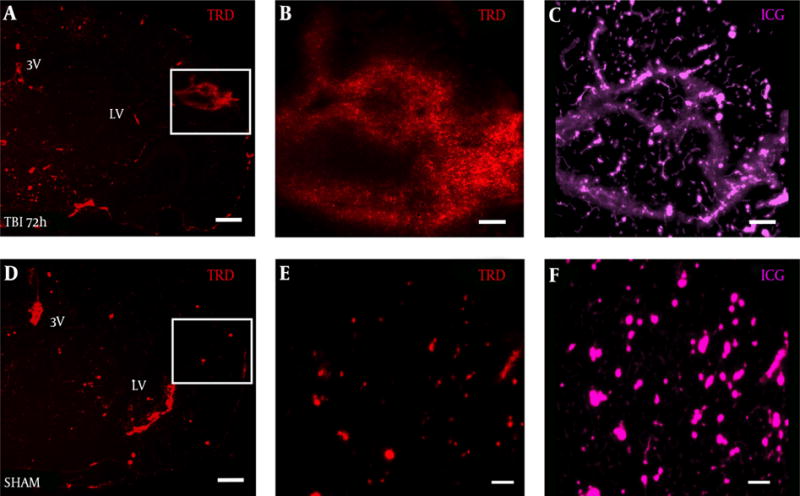
Figure 3. Vascular Injury Observed in the Ipsilateral S1BF Cortex After Blast.

Brain slice from a A, TBI mouse shows TRD distribution in the S1BF region compared to D, SHAM mouse brain slice; panels A, D both imaged at 2.5×, scale bar = 200 μm. White box in panel A, outlines rightward panels showing vascular disruption with B, TRD distributed in a similar pattern to C, ICG-albumin; White box in panel D, outlines rightward panels showing intact blood vessels E, with TRD and F, ICG-albumin; panels B, C, E, F, all imaged at 12.6×, scale bars = 50 μm. TRD = Texas red dextran; ICG = indocyanine green.
