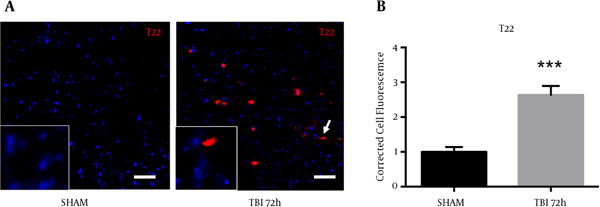
Figure 8. Oligimeric Tau Observed in the S1BF Region After Blast.

A, blast exposure revealed an elevated fluorescence of T22 (oligomeric tau); B, A significant increase in T22 total cell fluorescence was measured at 72 hours post-blast (*P < 0.001 vs SHAM). Two-tailed Standard t-test. Mean ± sem. n = 5.
