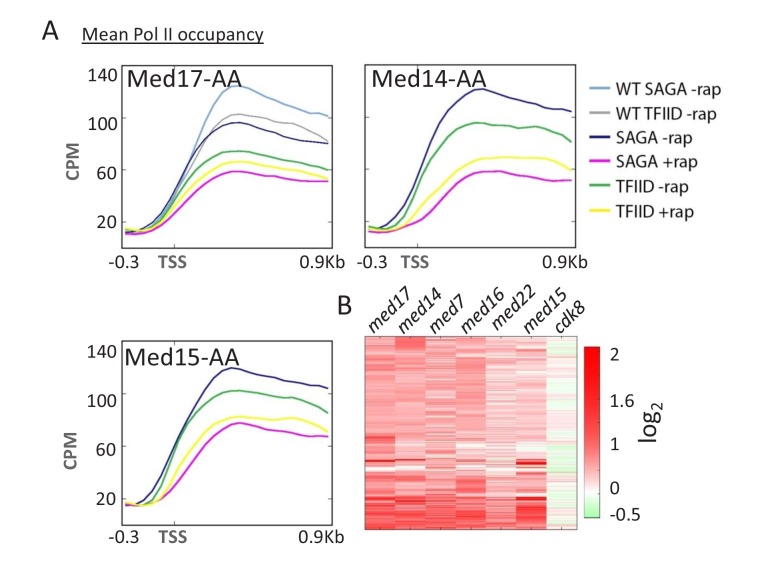
Figure 2. Mediator preferentially affects SAGA-dependent vs.
TFIID-dependent genes. (A) Mean Pol II occupancy for the indicated groups of genes (SAGA or TFIID-dependent) prior to and after anchor-away of Med17, Med14, and Med15, as well as for the parent strain (WT). Sequence reads were normalized as counts per million (CPM), and the curves were aligned relative to the transcription start site (TSS). (B) Heat map of Pol II levels (log2 scale) at individual genes before vs. after anchor-away of the indicated Mediator subunits. Occupancy changes upon anchor-away are indicated as decreases (red) or increases (green).


