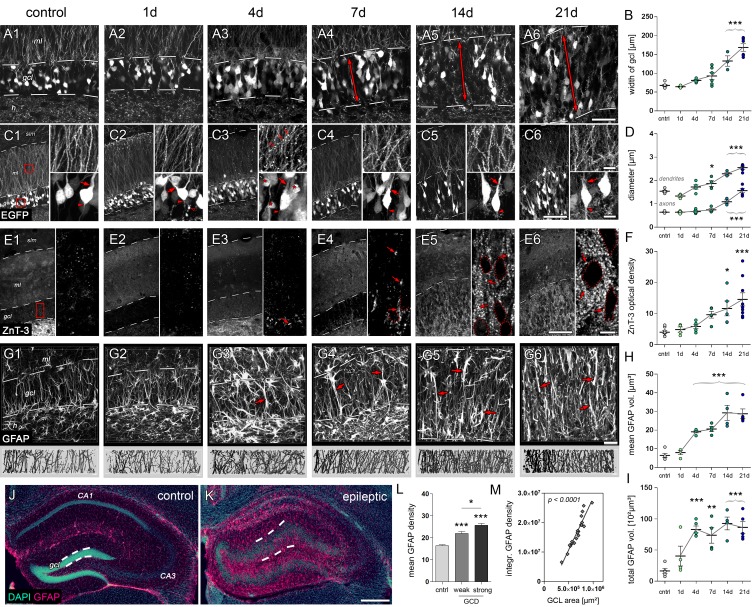
Figure 4. Microstructural alterations in the DG during epileptogenesis.
(A1-6 and C1-6) Representative confocal images show changes in the cytoarchitecture of the DG (double-headed arrows denote the dispersion of the GCL) and morphological features of individual eGFP-labeled granule cells, respectively (left panel: Overview; upper and lower right: High-magnification of granule cell dendrites or somata, respectively; red arrowheads, axon initial segments; red arrows, stem dendrites; red open arrows, dendritic swellings; red asterisks, degenerating granule cells. (B) Quantification of the GCL width (ncntrl = 7, n1d = 3, n4d = 5, n7d = 6, n14d = 3, n21d = 6) and (D) the diameter of initial axons and stem dendrites (ncntrl = 5, n1d = 3, n4d = 5, n7d = 4, n14d = 3, n21d = 5). (E1-6) Representative confocal z-plane images of ZnT-3 staining in the DG to determine the dynamics of mossy fiber sprouting (red arrows; ncntrl = 8, n1d = 4, n4d = 5, n7d = 5, n14d = 5, n21d = 9). Locations of granule cell somata are spared (dotted outlines). (F) Quantitative analysis of ZnT-3 optical density. (G1-6) Representative confocal images of GFAP-stained sections (upper panel) and corresponding 3D-reconstruction in the GCL (lower panel). h, hilus; gcl, granule cell layer; ml, molecular layer; slm, stratum lacunosum moleculare. (H–I) Quantitative analysis of the mean and total volume of GFAP-stained processes from radial glia cells in the GCL (ncntrl = 5, n1d = 4, n4d = 5, n7d = 4, n14d = 4, n21d = 5). All statistics were performed with one-way ANOVA, Dunnett’s post-test (compared to saline controls); *p<0.05, **p<0.01, ***p<0.001. (J, K) Representative sections stained for DAPI (turquoise) and GFAP (magenta) in controls and chronic epileptic mice (21d following kainate injection), respectively. Dashed lines denote the borders of the GCL. (L) Quantitative analysis for the optical density of GFAP in individual sections from three controls and in sections from three kainate-injected mice exhibiting weak and strong GCD (one-way ANOVA, Dunnett’s post-test; *p<0.05, **p<0.01, ***p<0.001; number of sections, ncntrl = 51, nw-GCD = 6, ns-GCD = 14). (M) Corresponding linear regression analysis for the integrated GFAP optical density and (I) the area of the GCL (Pearson’s correlation). Scale bars in A, 50 µm; in C (left), 100 µm; in C (right), 10 µm; in E (left), 100 µm; in E (right), 10 µm; in G, 30 µm; in K, 200 µm.

