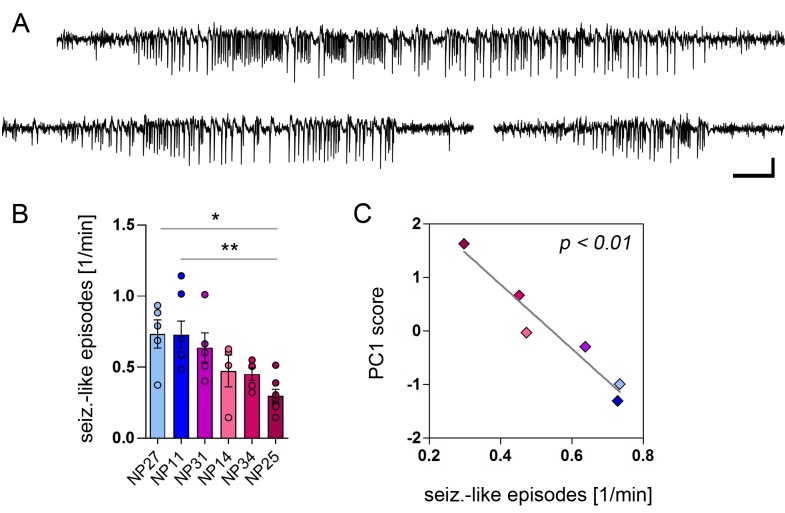
Figure 9. PCA-verified biomarkers predict the seizure severity.
(A) Representative EEG recordings from the ipsilateral hippocampus showing three examples of identified seizure-like episodes. Scale bars: Horizontal 5 s, vertical 2 mV. (B) Quantitative analysis of seizure-like episodes for individual epileptic mice (color-coded; note that EEG data is lacking for NP26). One-way ANOVA, Bonferroni’s post-test, *p<0.05, **p<0.01, number of recordings: nNP27 = 5, nNP11 = 7, nNP31 = 5, nNP14 = 4, nNP34 = 5, nNP25 = 7. Values are presented as the mean ± SEM. (C) Pearson’s correlation analysis of PC1 scores and the frequency of seizure-like episodes (n = 6).


