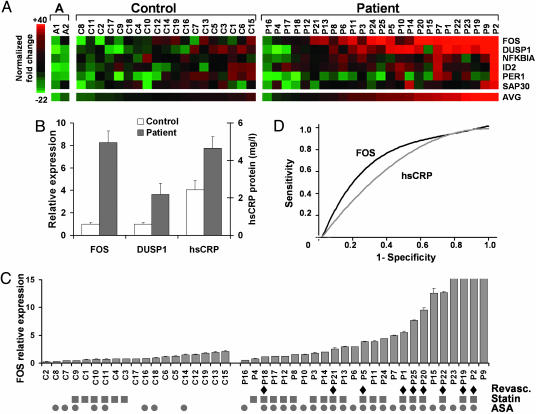
Fig. 1.
Analysis and significance of candidate gene mRNA levels in control subjects and CEA patients. (A) Normalized fold-change expression levels of the candidate genes are color-coded (red, induced; green, repressed). The subjects are ordered by the average expression values of the six genes (AVG). The three groups are composed of: A, younger controls A1 and A2; Control, C1–C19; and Patient, P1–P25. (B) Relative expression levels of FOS and DUSP1 mRNAs, and plasma hsCRP protein levels in Control (n = 19) versus Patient (n = 25). Values shown as mean ± SE. (C) Controls and patients ordered by the relative level of FOS expression within each group. Diamonds, indicate history of coronary revascularization either by angioplasty or coronary artery bypass graft surgery (Revasc.); squares, current 3-hydroxy-3-methyl-glutaryl (HMG) CoA reductase inhibitor treatment (Statin); circles, current aspirin treatment (ASA). All RT-PCR measurements were done in duplicate and repeated at least twice. For presentation purposes, the FOS relative expression values were truncate at 15; the actual values for P23, P19, P2, and P9 were 19.5 ± 0.2, 27.3 ± 2.6, 34.7 ± 3.5, and 39.6 ± 2.2, respectively. (D) Receiver operating characteristic curves for the utility of FOS (black) and hsCRP (gray) at identifying coronary revascularization history among all patients in the study.

