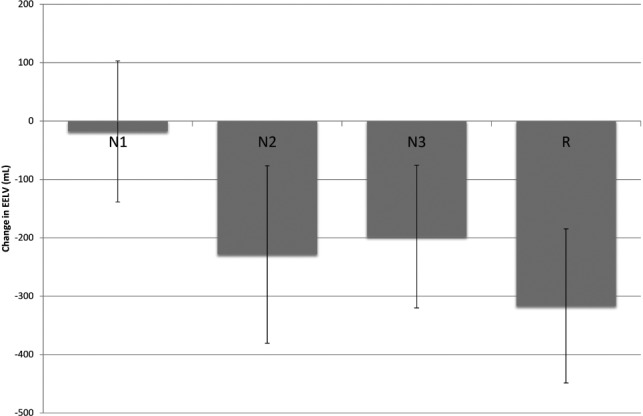
Figure 4. Mean ΔEELV between stages of sleep.

Bar graph depicting ΔEELV with standard deviations through different stages of sleep: N1, N2, N3, and R. The difference in variance of ΔEELV between each stage of sleep is similar. Mean ΔEELV between non-stage R and stage R sleep was statistically significant. See Table 3 for significant changes for each subject. ΔEELV = change in end-expiratory lung volume.
