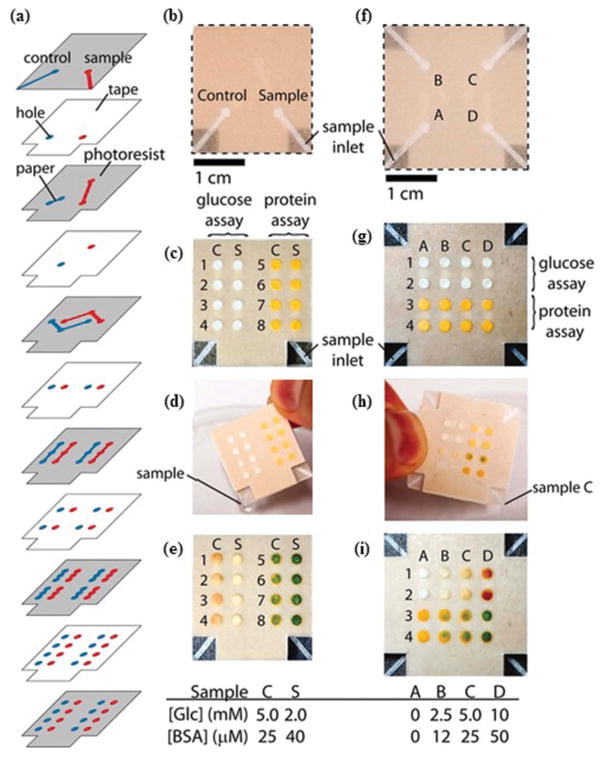
Figure 9.
(Adapted from [78] Copyright (2008) National Academy of Sciences, U.S.A.) A three dimensional μPAD (a) Schematic representation of layers of tape and paper in a 3D microfluidic device. (b) Photograph showing the front of the dual-assay device. (c) Back of the device containing reagents for colorimetric detection of glucose and proteins. (d) Device containing a sample of artificial urine with 2-mM glucose and 40 μM BSA. 25 μL of sample is poured into device in 2 min. (e) Pictorial representation of the results of the assays for control and sample. (f) Top of the four-assay device. (g) Back of the three dimensional paper-based microfluidic device. (h) Device containing samples. Each corner of the device was dipped into a specific artificial urine sample. (i) Picture showing the results of the assays.

