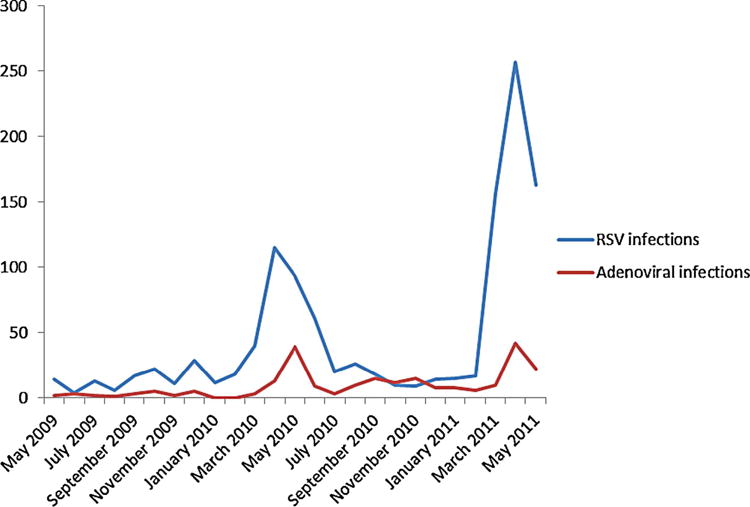
Fig. 1.

Monthly number of RSV and adenoviral acute lower respiratory infections. The X-axis shows the date (covering the period from May 2009 through May 2011). The Y-axis shows the monthly number of RSV and adenoviral acute lower respiratory infections
