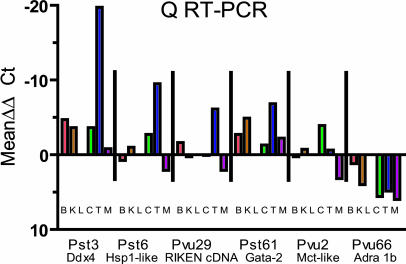
Fig. 5.
Graphical representation (SYBR Green RT-PCR) of tissue expression of genes associated with TDMs relative to expression in liver. Expression levels were standardized to GAPDH by calculating ΔCt (ΔCt = Gene Ct - GAPDH Ct). The mean ΔΔCt values were determined by subtracting the ΔCt for liver expression from the ΔCt of each of the other tissues. For most genes, liver expression was low or was the lowest of the tissues (e.g., Pst3 and Pst61).

