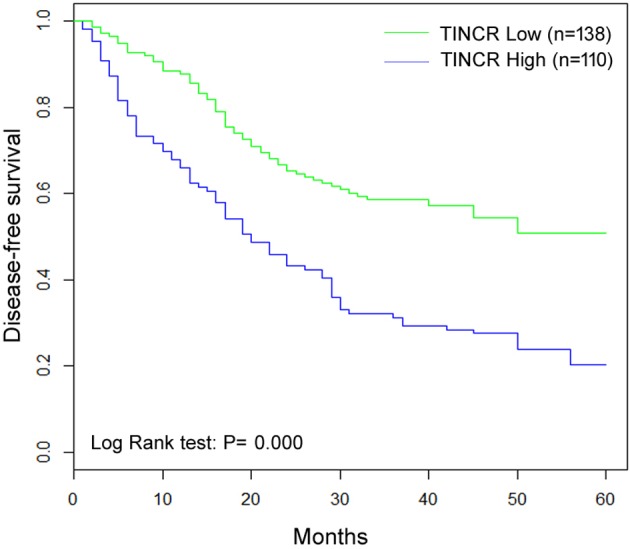
Figure 2. Kaplan–Meier curves for DFS of HCC patients with high and low TINCR mRNA expression levels.

Patients with high TINCR mRNA levels (fold change ≥2) tended to have a shorter DFS time (P=0.000).

Patients with high TINCR mRNA levels (fold change ≥2) tended to have a shorter DFS time (P=0.000).