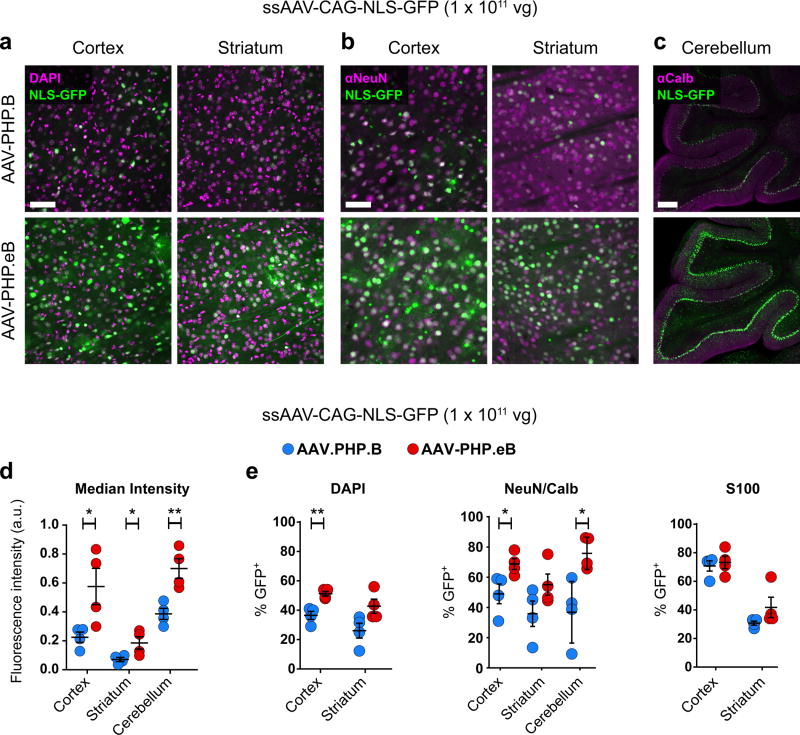
Figure 2. AAV-PHP.eB transduces several CNS regions more efficiently than AAV-PHP.B.
ssAAV-PHP.B:CAG-NLS-GFP or ssAAV-PHP.eB:CAG-NLS-GFP was intravenously injected into adult mice at 1 × 10¹¹ vg/mouse. Native GFP fluorescence was assessed after three weeks of expression. (a and b) Representative images of native GFP fluorescence (green) and DAPI staining (a, magenta) or NeuN staining (b, magenta) in the cortex and striatum. (c) Representative images of Calbindin immunohistochemistry (IHC) (magenta) in the cerebellum. (d) Mean GFP intensity in all DAPI+ nuclei in the cortex (t6 = 2.688; P = 0.0361) and striatum (t6 = 2.536; P = 0.0443) or in Calbindin+ cells in the cerebellum (t6 = 4.007; P = 0.0071). (e) Quantification of cell transduction. From left to right: The percentage of DAPI+ cells that express GFP in the cortex (t6 = 4.669; P = 0.0034) and striatum (t6 = 2.390; P = 0.0541). The percentage of NeuN+ cells that express GFP in the cortex (t6 = 2.662; P = 0.037) and in the striatum (t6 = 1.764; P = 0.128). The percentage of Calbindin+ cerebellar Purkinje cells that express GFP (t6 = 3.328; P = 0.039). The percentage of S100+ cells that express GFP in the cortex (t6 = 0.4422; P = 0.6738) and striatum (t6 = 1.512; P = 0.1814). (d and e) For quantification: n = 4 mice per group, mean ± SEM, unpaired, two-tailed t-test (***P ≤ 0.001; **P ≤ 0.01; *P ≤ 0.05; n.s., P ≥ 0.05). All images were single-plane confocal images of native GFP fluorescence. Scale bars are 50 µm (a and b) and 100 µm (c).

