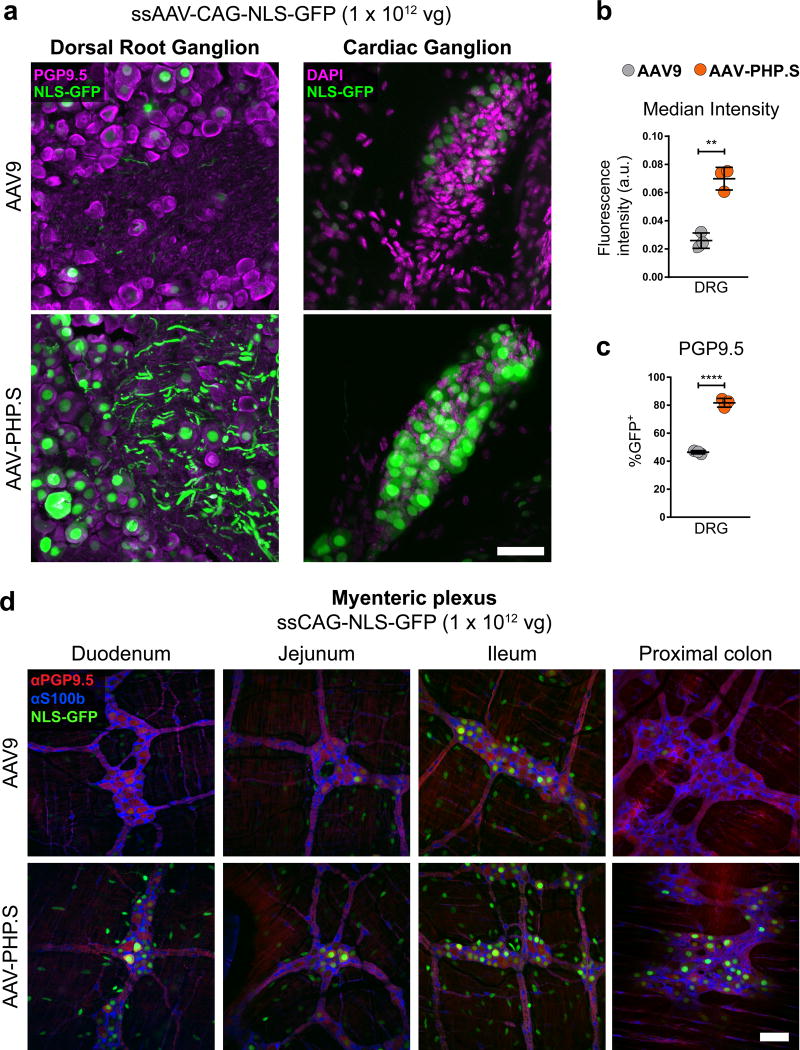
Figure 3. AAV-PHP.S efficiently transduces peripheral neurons.
ssAAV-PHP.S:CAG-NLS-GFP or ssAAV9:CAG-NLS-GFP was intravenously injected into adult mice at 1 × 10¹² vg/mouse. Native GFP fluorescence was assessed after three weeks of expression. (a) Representative images of GFP expression and neuronal PGP9.5 (left, magenta) or DAPI (right, magenta) staining in a dorsal root ganglion (DRG, left) and cardiac ganglion (right). (b) Quantification of the mean GFP fluorescence intensity per cell with AAV-PHP.S or AAV9 (t4 = 7.814; P = 0.0014) (c) Quantification of the percentage of PGP9.5+ cells transduced (t4 = 18.29; P < 0.0001) (d) Representative images of GFP expression, with neuronal PGP9.5 (red) and astrocyte S100b (blue) staining in the myenteric plexus of the duodenum, jejunum, lleum and proximal colon. In (b and c) n = 3 independent animals per group, mean ± SEM, unpaired, two-tailed t-test. For representative images (a; n = 3 animals) and (d; n = 2 animals). All imaging and display conditions are matched in the GFP channel across panel pairs. Scale bars in (a and d) are 50 µm.

