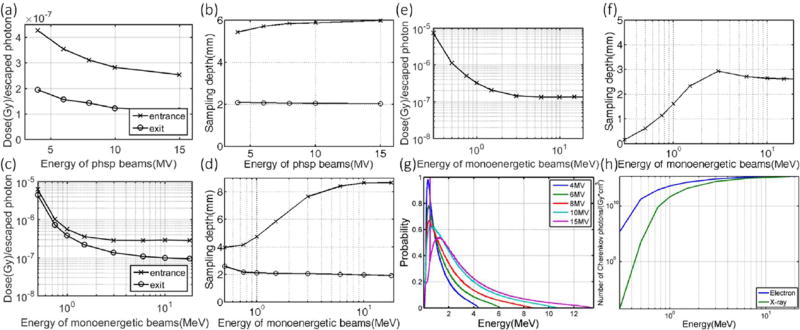
Figure 3.
The correlation factors are shown for x-ray and electron beams with different energies -correlation factors for x-ray beams generated from phase space files for different energies are shown in (a) with corresponding sampling depths shown in (b). Correlation factors for mono-energetic radiation beams are shown in (c, e) with corresponding sampling depths shown in (d, f) for x-ray and electron beam respectively. The energy spectrum with probability normalized by the sum for different phase space files is shown in (g) and with the number of Cherenkov photons generated in unit volume per Gy of radiation dose shown in (h) for x-ray and electron beams of different mono energies.

