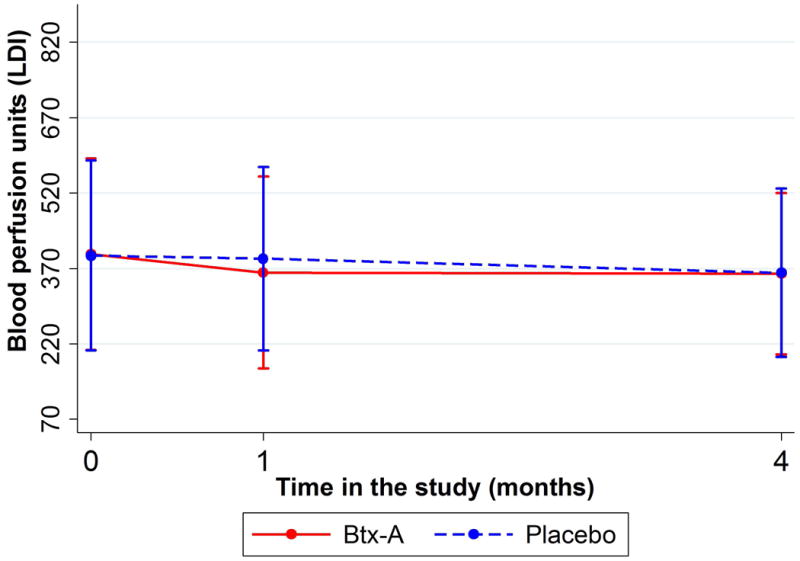
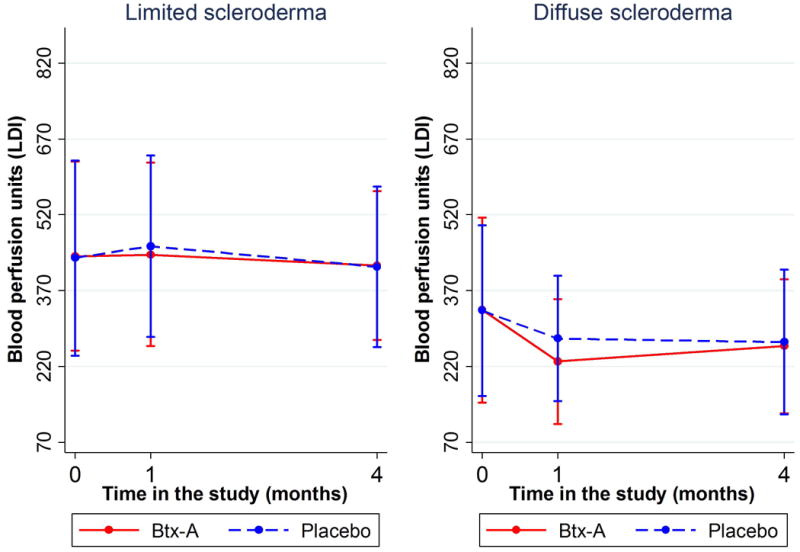
Figure 2.


Figure 2A (top): Change in blood perfusion (measured with LDI scanner) by treatment arm over time. Presented as means and standard deviation bars. Figure 2B (bottom): Change in blood perfusion (measured with LDI scanner) over time by type of scleroderma. Presented as means and standard deviation bars.
