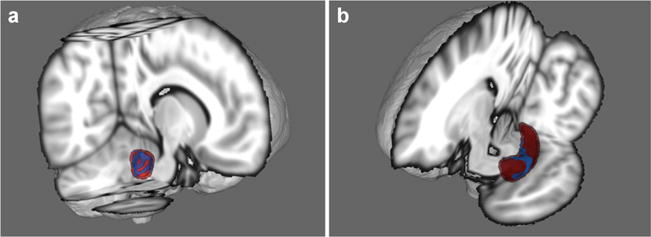
Fig. 1.

Area in blue represents the surface region where a significant HIV*Adversity interaction was observed. Fig. A shows the right amygdala and Fig. B shows the left hippocampus (seen from sagittal and coronal views, respectively). HIV+ participants with higher adversity scores evidenced the greatest atrophy of these regions
