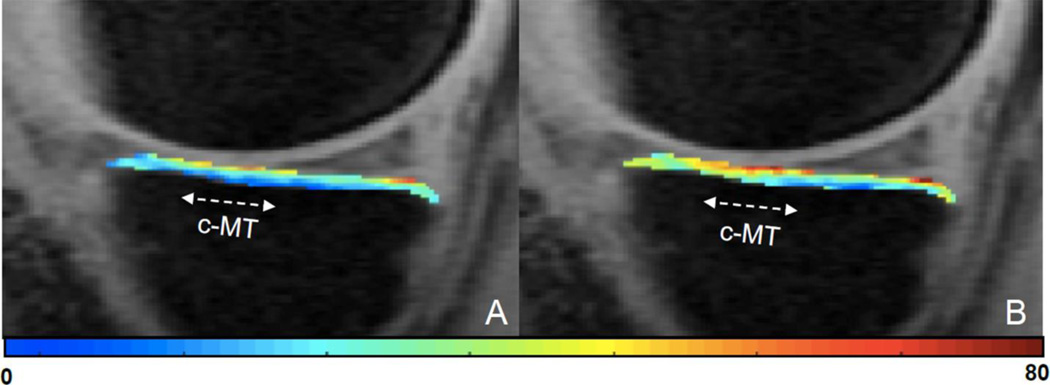
Figure 3.
A T1ρ color map of the central medial tibia, at baseline (Figure 3A) and 12 months after ACLR (Figure 3B), in a 25 year old male ACL-reconstruction (ACLR) patient with a cyclops lesion. The colormap indicates an increase in the T1ρ relaxation time within the central medial tibia (c-MT) at 12 months after ACLR.

