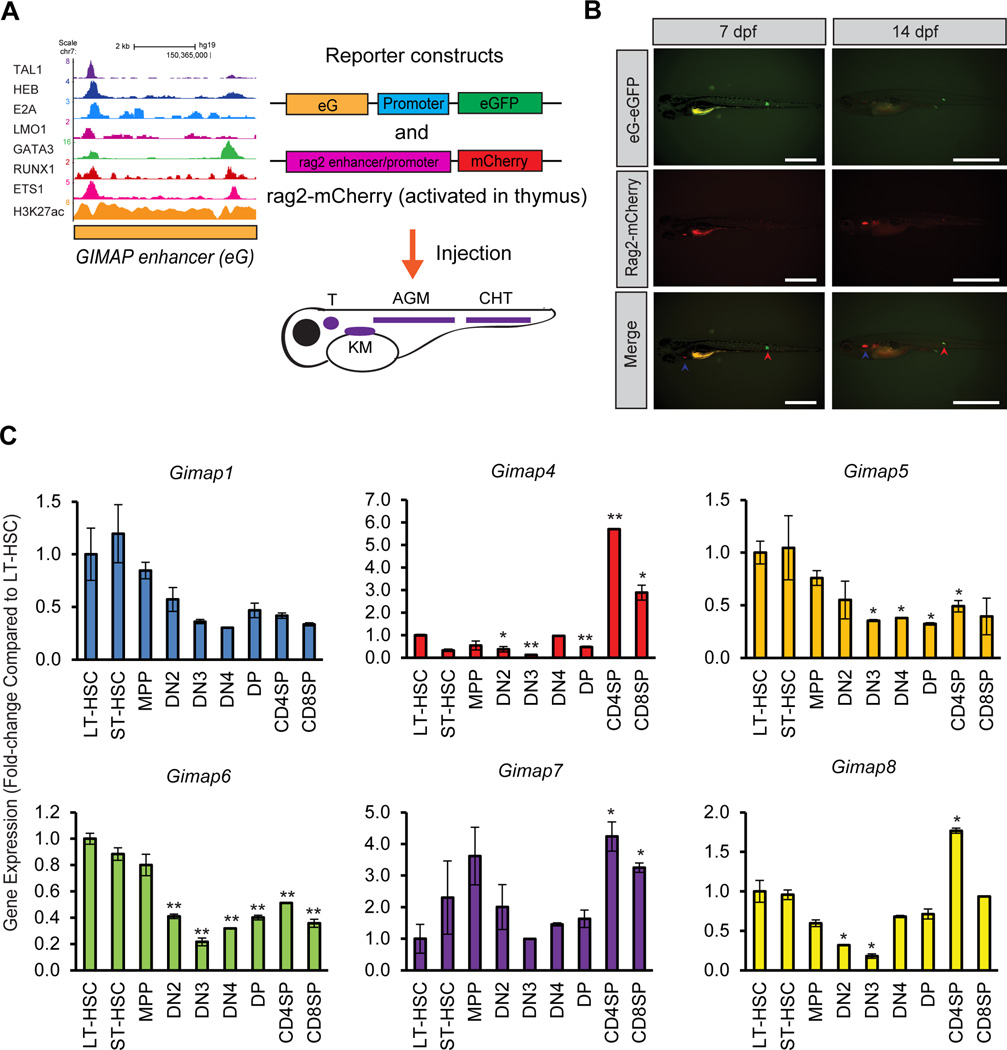
Figure 4. The GIMAP enhancer is repressed in immature thymocytes.
(A) Schematic representation of the experimental design. The GIMAP enhancer (eG) was introduced into the reporter construct carrying a minimal promoter sequence (promoter) and an eGFP gene. The zebrafish rag2 promoter was cloned into the reporter construct encoding a mCherry gene. The reporter constructs were injected into a single-cell zebrafish embryo. See Figure 3A for details. (B) The GIMAP enhancer is not activated in immature zebrafish thymocytes. Fluorescent images show one representative zebrafish (n=4) injected with reporter constructs at 7 and 14 dpf. The CHT and thymus are indicated by red and blue arrowheads, respectively. Scale bar, 1 mm. (C) mRNA expression levels of Gimap genes in mouse hematopoietic cells. Total RNA was harvested from mouse hematopoietic cells at different stages: long-term HSC (LT-HSC), short-term HSC (ST-HSC), multi-potent progenitor (MPP), double-negative 2 (DN2), DN3, DN4, double-positive (DP), CD4-single-positive (CD4SP) and CD8-single-positive (CD8SP). Expression levels in DN1 cells could not be analyzed due to the lack of a sufficient sample size. The mRNA expression levels of six Gimap genes (Gimap1, Gimap4, Gimap5, Gimap6, Gimap7, and Gimap8) as well as β-actin were measured by quantitative RT-PCR analysis. The expression values were normalized to that of β-actin and were shown as fold-changes compared to LT-HSCs. The values are presented as the means ± SD of two samples. *p<0.05, **p<0.01 by a two-sample, two-tailed t-test compared to the expression in LT-HSC.

