
Figure 7.
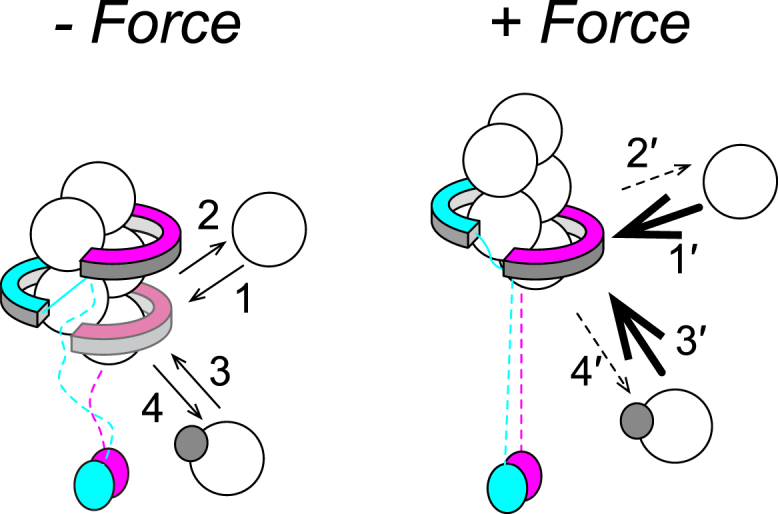
Molecular model of force-dependent actin filament regulation. The large white and small gray spheres represent actin molecules and profilins, respectively. Stretching force enhances FH2 dimer-half (magenta) translocation to increase the open state probability. Numbered steps show G-actin association to and dissociation from the barbed end, independent of (1 [1′] and 2 [2′]) and complexed with (3 [3′] and 4 [4′]) profilin, respectively. Notably, 3 [3′] (and 4 [4′]) include both FH1-dependent and independent processes. The capture-and-delivery mechanism of the profilin-actin complex between the flexible FH1 domain and the barbed end is assumed to remain functional under tension, but the FH1 domains are shown as broken lines because the structure has not yet been clarified (see Discussion). Under tension, steps 1 and 3 are accelerated, as shown by 1′ and 3′ (bold arrows), whereas steps 2 and 4 are repressed, as shown by 2′ and 4′ (broken arrows). To see this figure in color, go online.