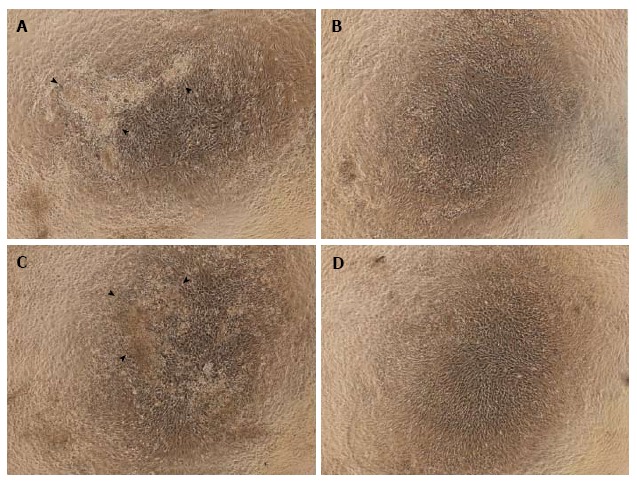
Figure 2.

Observations of cell morphology and calcium deposition. Cells treated with normoxia (21% O2) for 14 d (NN) (A) or hypoxia (5% O2) for 7 d followed by normoxia for 7 d (HN) (C) were differentiated and cuboidal-shaped, and showed cell nodules with calcium deposits. These changes were not present in cells exposed to normoxia for 7 d followed by hypoxia for 7 d (NH) (B) or hypoxia for 14 d (HH) (D). Arrowheads indicate calcium deposition.
