FIGURE 5.

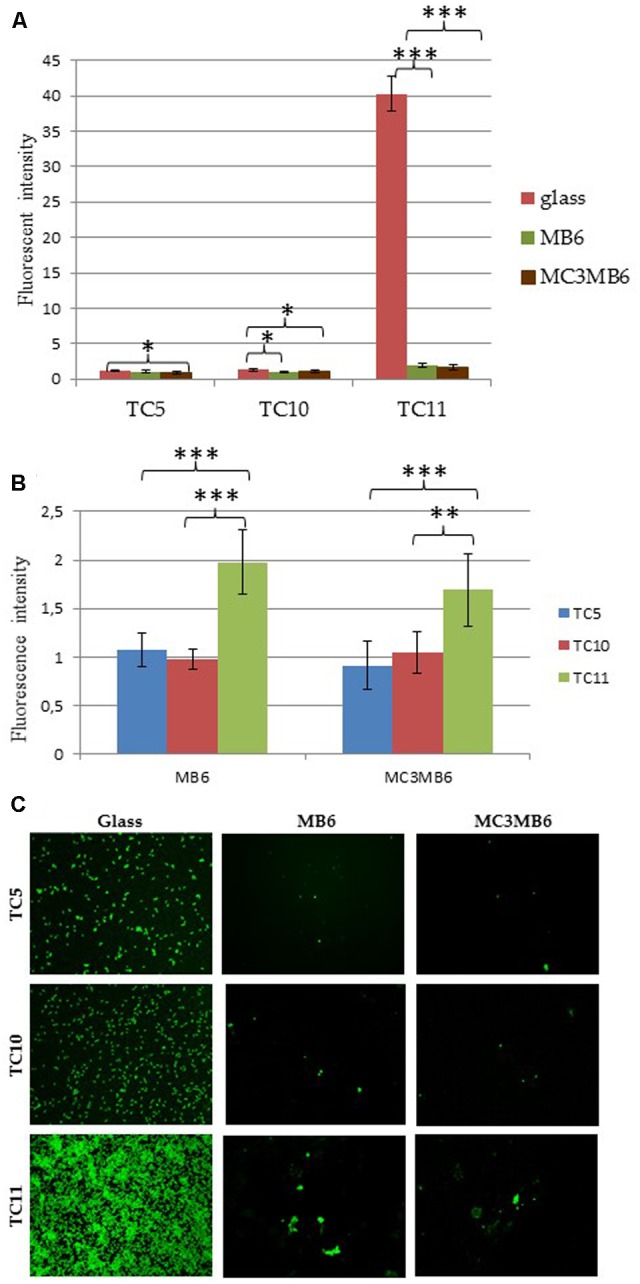
Adhesion of TC5, TC10, and TC11 on MB6 and MC3MB6 surfaces. Adhesion was first measured at the population level in 24 well plates. (A,B) Are different statistical analysis displays of the same measurement. After 24 h of incubation at 20°C, bacteria were stained by Syto 9 green fluorescent nucleic and fluorescent intensity was measured using a TECAN microplate reader as a representation of bacterial adhesion. Bars represent the standard deviation obtained from three independent measures. Statistical significance was accepted at p < 0.05. ∗p < 0.05, ∗∗p < 0.01, ∗∗∗p < 0.001. (C) Show the CSLM visualization of adhered bacteria on the surfaces. The same coverslips were used in the microplate assay and in CSLM. Glass coverslips were used as a control.
