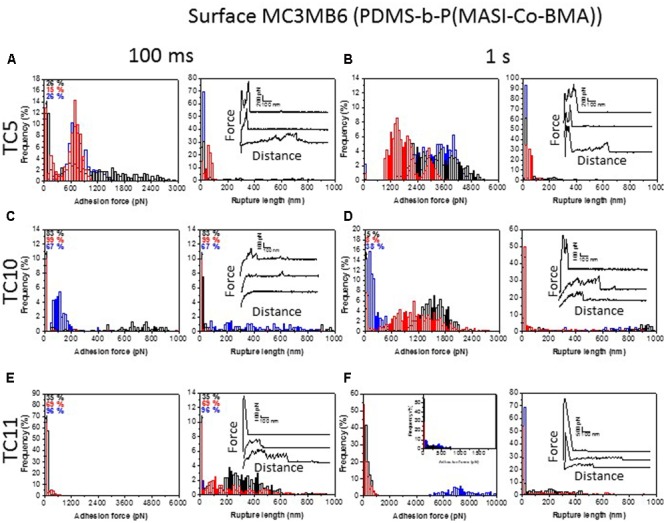
FIGURE 8.

Single-cell force spectroscopy analysis on surface MC3MB6. Adhesion force (left) and rupture length histograms with representative retraction force profiles (right) obtained by recording multiple force-distance curves between single TC5 (A,B), TC10 (C,D), or TC11 (E,F) bacteria and surface MC3MB6 at short (100 ms, A,C,E) or prolonged (1 s, B,D,F) contact times. Black, red, and blue colors represent results from three cells from independent cultures (n > 400 force-distance curves for each cell).
