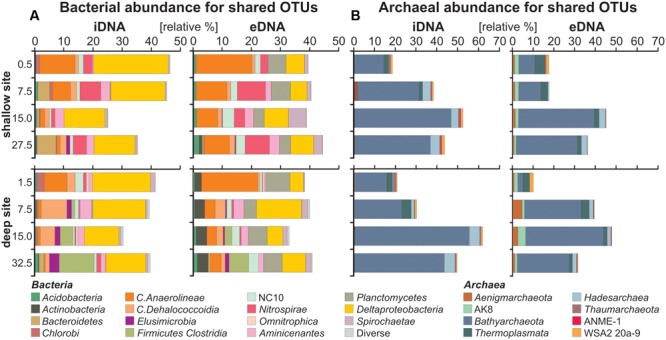
FIGURE 3.

Relative abundances of bacterial and archaeal OTUs shared by both intra- and extracellular fractions. (A) Bacterial bar charts plotted for the iDNA and eDNA in parallel used to infer growth, decline or dormancy of certain populations (iDNA), as well as cell lysis and sequence turnover (eDNA) with depth. (B) Archaeal bar charts plotted for the iDNA and eDNA in parallel.
